Matchup
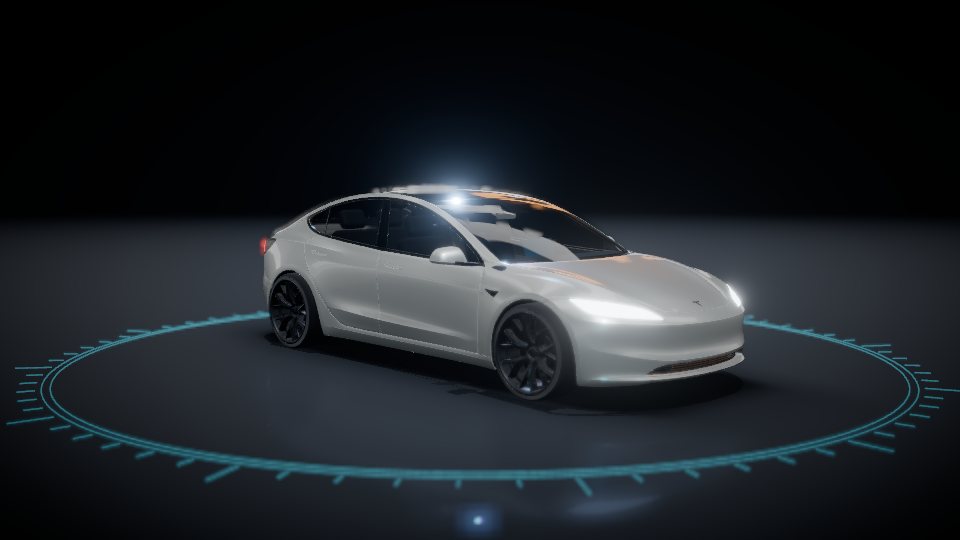
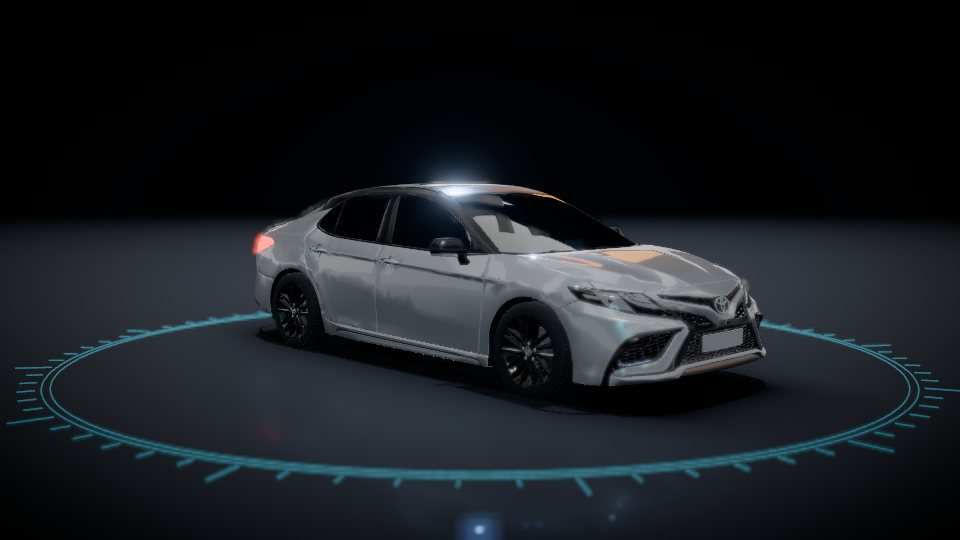
Tesla Model 3 vs Toyota Camry
The 2026 Model 3 Premium RWD against the 2026 Camry LE FWD, through ten physics labs and every official rating we could find.
Last checked Oct 1, 2026. Every figure links to its source.
The short answer
- In the trims shown, the Camry costs $13,235 less: $30,895 against $44,130 for the Model 3, destination included. PublishedTeslaPublishedToyota
- At 15,000 miles a year and national average prices, the Model 3 costs about $641 a year less to run: $676/yr against $1,317/yr. DerivedEPADerivedEPA
- The Camry stops from 70 mph in 171 ft, 7 ft shorter than the Model 3 (178 ft). TestedCar and DriverTestedCar and Driver
- The Model 3 gets to 60 mph 2.4 s sooner: 4.6 s against 7.0 s. TestedCar and DriverTestedCar and Driver
Who each one suits
The Camry costs $13,235 less in these trims, stops 7 ft shorter from 70 mph, has more rear knee room and head room, and its low beams reach 47 ft farther. It’s an IIHS Top Safety Pick+.
The Model 3 costs about $641 a year less to run, gets to 60 mph 2.4 s sooner, has 6.0 cu ft more cargo space and lower rollover risk.
At a glance
| Model 3 | Camry | |
|---|---|---|
| Starting price, this trim | $44,130PublishedTesla | $30,895PublishedToyota |
| Powertrain | Permanent-magnet synchronous rear motor · Rear-wheel drive, single motor | 2.5 L four-cylinder + two electric motors · Front-wheel drive |
| 0–60 mph, tested or claimed | 4.6 sTestedCar and Driver | 7.0 sTestedCar and Driver |
| Braking 70–0 mph, tested | 178 ft (54.3 m)TestedCar and Driver | 171 ft (52.1 m)TestedCar and Driver |
| EPA combined | no data | 51 mpg (4.6 L/100 km)PublishedEPA |
| EPA efficiency | 137 MPGePublishedEPA | no data |
| EPA range | 363 mi (584 km)PublishedEPA | no data |
| Cargo behind the second row | 21.0 cu ft (595 L)TestedCar and Driver | 15.0 cu ft (425 L)TestedCar and Driver |
| Large suitcases, packed | 2Simulatedfrom Tesla | 2Simulatedfrom Toyota |
| Seats | 5Published | 5PublishedToyota |
| Crash ratings | NHTSA 5★ overall · IIHS crash tests G/A/G | NHTSA 5★ overall · IIHS Top Safety Pick+ |
Acceleration
The Model 3 gets to 60 mph 2.4 s sooner: 4.6 s against 7.0 s.
| Model 3 | Camry | |
|---|---|---|
| Power | 286 hp (213 kW)PublishedCar and Driver | 225 hp (168 kW)PublishedToyota |
| Torque | 322 lb-ft (437 Nm)PublishedCar and Driver | 163 lb-ft (221 Nm)PublishedToyota |
| 0–60 mph, tested or claimed | 4.6 sTestedCar and Driver | 7.0 sTestedCar and Driver |
| 0–60 mph, our simulation | 4.8 sSimulatedfrom Car and Driver | 6.7 sSimulatedfrom Car and Driver |
| Passing, 50–70 mph | 2.4 sTestedCar and Driver | 4.8 sTestedCar and Driver |
| Quarter mile | 13.2 sTestedCar and Driver | 15.4 sTestedCar and Driver |
Braking and stopping distance
The Camry stops from 70 mph in 171 ft, 7 ft shorter than the Model 3 (178 ft).
| Model 3 | Camry | |
|---|---|---|
| Braking 70–0 mph, tested | 178 ft (54.3 m)TestedCar and Driver | 171 ft (52.1 m)TestedCar and Driver |
| Wet road from 70 mph, 1 s reaction | 367 ft (111.7 m)Simulatedfrom Car and Driver | 364 ft (110.8 m)Simulated, estimated inputs |
| Dry road from 70 mph, 1 s reaction | 281 ft (85.6 m)Simulatedfrom Car and Driver | 279 ft (85.0 m)Simulated, estimated inputs |
| Packed snow from 30 mph, 1 s reaction | 170 ft (51.8 m)Simulatedfrom Car and Driver | 169 ft (51.4 m)Simulated, estimated inputs |
Rollover
NHTSA puts the Model 3’s single-vehicle rollover risk lower: 6.8% risk against 9.7% risk for the Camry.
| Model 3 | Camry | |
|---|---|---|
| NHTSA rollover rating | 5★ · 6.8% riskTestedNHTSA | 5★ · 9.7% riskTestedNHTSA |
| Sideways slide that trips it into a roll | 15 mph (24 km/h)Simulated, estimated inputs | 13 mph (22 km/h)Simulated, estimated inputs |
| Static stability factor (half-track ÷ CoG height) | 1.62Simulated, estimated inputs | 1.45Simulated, estimated inputs |
Efficiency and running costs
At 15,000 miles a year and national average prices, the Model 3 costs about $641 a year less to run: $676/yr against $1,317/yr.
| Model 3 | Camry | |
|---|---|---|
| EPA combined | no data | 51 mpg (4.6 L/100 km)PublishedEPA |
| EPA efficiency | 137 MPGePublishedEPA | no data |
| EPA range | 363 mi (584 km)PublishedEPA | no data |
| Fuel or charging, 15,000 mi a year | $676/yrDerivedEPA | $1,317/yrDerivedEPA |
| Steady 75 mph, our simulation | 24 kWh/100 mi (14.9 kWh/100 km)Simulatedfrom Car and Driver | 49 mpg (4.8 L/100 km)Simulated, estimated inputs |
| Drag coefficient | 0.22PublishedCar and Driver | 0.29Estimate |
Grip, snow and maneuvering
The Camry held 0.87 g on the skidpad against 0.84 g for the Model 3.
| Model 3 | Camry | |
|---|---|---|
| Skidpad grip, tested | 0.84 gTestedCar and Driver | 0.87 gTestedCar and Driver |
| Cornering grip, our simulation | 0.84 gSimulatedfrom Car and Driver | 0.82 gSimulated, estimated inputs |
| Pulling away on packed snow | 0.14 gSimulatedfrom Car and Driver | 0.14 gSimulated, estimated inputs |
| Turning circle | 38.4 ft (11.7 m)PublishedJ.D. Power | 37.4 ft (11.4 m)PublishedToyota |
| Ground clearance | 5.4 in (14 cm)PublishedTesla | 5.4 in (14 cm)PublishedToyota |
| Tires | Michelin Primacy All Season (T0) · 235/45R18TestedCar and Driver | All-season touring 205/65R16 · 205/65R16PublishedToyota |
Space, luggage and fit
Behind a 5-ft-11 driver, a 5-ft-11 passenger gets +5.2 in of knee room in the Camry and +2.5 in in the Model 3.
| Model 3 | Camry | |
|---|---|---|
| Seats | 5Published | 5PublishedToyota |
| Large suitcases, packed | 2Simulatedfrom Tesla | 2Simulatedfrom Toyota |
| Carry-ons in the space left | 3Simulatedfrom Tesla | 0Simulatedfrom Toyota |
| Cargo behind the second row | 21.0 cu ft (595 L)TestedCar and Driver | 15.0 cu ft (425 L)TestedCar and Driver |
| Front trunk | 3.0 cu ft (85 L)TestedCar and Driver | no data |
| Driver head room, 6 ft 4 in driver | −1.8 in (-5 cm)Simulated, estimated inputs | −0.4 in (-1 cm)Simulatedfrom Toyota |
| Driver head room, 5 ft 11 in driver | +0.4 in (1 cm)Simulated, estimated inputs | +2.0 in (5 cm)Simulatedfrom Toyota |
| Driver head room, 5 ft 4 in driver | +3.3 in (8 cm)Simulated, estimated inputs | +5.2 in (13 cm)Simulatedfrom Toyota |
| Rear head room, 5 ft 11 in passenger | −0.7 in (-2 cm)Simulated, estimated inputs | −0.5 in (-1 cm)Simulatedfrom Toyota |
| Rear knee room, 5 ft 11 in behind 5 ft 11 in | +2.5 in (6 cm)Simulated, estimated inputs | +5.2 in (13 cm)Simulatedfrom Toyota |
| Rear head and knee, 6 ft 4 in behind 6 ft 4 in | −3.2 in head · −1.8 in kneeSimulated, estimated inputs | −3.1 in head · +0.9 in kneeSimulatedfrom Toyota |
| Front head room, published | 40.3 in (102 cm)PublishedTesla | 38.3 in (97 cm)PublishedToyota |
| Rear head room, published | 37.8 in (96 cm)PublishedTesla | 37.6 in (96 cm)PublishedToyota |
| Rear leg room, published | 34.5 in (88 cm)PublishedTesla | 38.0 in (97 cm)PublishedToyota |
Cabin noise
No meaningful gap between the Model 3 and the Camry on what we can measure here.
| Model 3 | Camry | |
|---|---|---|
| Cabin sound at 70 mph | 67 dBATestedCar and Driver | 67 dBAEstimateCar and Driver |
Visibility
From the driver’s seat the Model 3’s hood hides the first 13 ft of road; the Camry’s hides 20 ft.
| Model 3 | Camry | |
|---|---|---|
| Road hidden in front of the bumper, 5 ft 9 in driver | 13 ft (3.9 m)Simulated | 20 ft (6.2 m)Simulated |
| Ground visible within 33 ft ahead | 62%Simulated | 46%Simulated |
Headlights and night stopping
On low beams, the fastest you can drive the Camry and still stop inside the lit road is 61 mph; in the Model 3 it’s 53 mph (dry road, 1.5-second reaction).
| Model 3 | Camry | |
|---|---|---|
| IIHS headlight rating | AcceptableTestedIIHS | AcceptableTestedIIHS |
| Low beams, straight road (right edge) | 223 ft (68.0 m)TestedIIHS | 270 ft (82.4 m)TestedIIHS |
| Fastest you can stop inside the low beams | 53 mph (86 km/h)Simulatedfrom IIHS | 61 mph (99 km/h)Simulatedfrom IIHS |
| High beams, straight road (right edge) | 492 ft (150.1 m)TestedIIHS | 475 ft (144.8 m)TestedIIHS |
Crash safety
In the IIHS moderate overlap front test the Camry rates Good and the Model 3 Acceptable.
| Model 3 | Camry | |
|---|---|---|
| NHTSA overall | 5★TestedNHTSA | 5★TestedNHTSA |
| IIHS small overlap front | GoodTestedIIHS | GoodTestedIIHS |
| IIHS moderate overlap front (updated) | AcceptableTestedIIHS | GoodTestedIIHS |
| IIHS side (updated) | GoodTestedIIHS | GoodTestedIIHS |
| IIHS award | no data | 2026 Top Safety Pick+PublishedIIHS |
| Curb weight | 3,817 lb (1,731 kg)TestedCar and Driver | 3,450 lb (1,565 kg)PublishedToyota |
Where each one wins
Tesla Model 3
- At 15,000 miles a year and national average prices, the Model 3 costs about $641 a year less to run: $676/yr against $1,317/yr. DerivedEPADerivedEPA
- The Model 3 gets to 60 mph 2.4 s sooner: 4.6 s against 7.0 s. TestedCar and DriverTestedCar and Driver
- NHTSA puts the Model 3’s single-vehicle rollover risk lower: 6.8% risk against 9.7% risk for the Camry. TestedNHTSATestedNHTSA
- From the driver’s seat the Model 3’s hood hides the first 13 ft of road; the Camry’s hides 20 ft. Simulated
- Passing from 50 to 70 mph takes 2.4 s in the Model 3 and 4.8 s in the Camry. TestedCar and DriverTestedCar and Driver
- The Model 3 has 6.0 cu ft more cargo space behind its second row: 21.0 cu ft against 15.0 cu ft. TestedCar and DriverTestedCar and Driver
- The Model 3 makes 61 hp more: 286 hp against 225 hp. PublishedCar and DriverPublishedToyota
- Drivers see 62% of the ground within 33 ft of the Model 3’s nose and 46% in the Camry. Simulated
- It takes a 15 mph sideways slide into a curb to roll the Model 3; the Camry goes over at 13 mph. Simulated, estimated inputs
Toyota Camry
- In the trims shown, the Camry costs $13,235 less: $30,895 against $44,130 for the Model 3, destination included. PublishedTeslaPublishedToyota
- The Camry stops from 70 mph in 171 ft, 7 ft shorter than the Model 3 (178 ft). TestedCar and DriverTestedCar and Driver
- On low beams, the fastest you can drive the Camry and still stop inside the lit road is 61 mph; in the Model 3 it’s 53 mph (dry road, 1.5-second reaction). Simulatedfrom IIHSSimulatedfrom IIHS
- Behind a 5-ft-11 driver, a 5-ft-11 passenger gets +5.2 in of knee room in the Camry and +2.5 in in the Model 3. Simulated, estimated inputsSimulatedfrom Toyota
- A 6-ft-4 driver has −0.4 in between head and headliner in the Camry and −1.8 in in the Model 3. Simulated, estimated inputsSimulatedfrom Toyota
- IIHS measured the Camry’s low beams lighting the road 47 ft farther on a straightaway: 270 ft against 223 ft. TestedIIHSTestedIIHS
- In the IIHS moderate overlap front test the Camry rates Good and the Model 3 Acceptable. TestedIIHSTestedIIHS
- The Camry held 0.87 g on the skidpad against 0.84 g for the Model 3. TestedCar and DriverTestedCar and Driver
Other trims
- Camry LE FWD · on this page
- Camry XSE AWD
Keep comparing
Sources
- Tesla: Model 3: US prices with destination and order fees, curb mass (2026-09)
- Toyota: 2026 Camry trims and starting MSRP (AWD +$1,525) (2026-10)
- US EPA (fueleconomy.gov): 2026 Tesla Model 3 Premium RWD ratings (2026-09)
- US EPA (fueleconomy.gov): 2026 Toyota Camry HEV FF LE ratings (2026-10)
- Car and Driver: Tested: 2024 Tesla Model 3 Long Range RWD (now Premium RWD) (2024-10)
- Car and Driver: 2026 Toyota Camry Nightshade Test: Mainstream Favorite (Nightshade FWD) (2026-01)
- Car and Driver: Tested: 2025 Toyota Camry Carefully Evolves (XSE AWD) (2024-07)
- Tesla: Model 3 Owner’s Manual (2024+ Highland): dimensions, subsystems, wheels and tires (2026-09)
- Toyota: 2025 Camry eBrochure: specifications (dimensions, weights, tires, interior, cargo) (2024-06)
- Toyota USA Newsroom: Toyota Camry Goes Exclusively Hybrid Plus a New Look and More Technology (2025 Camry launch) (2024-04)
- Toyota: 2026 Camry eBrochure: specifications (engine, motors, brakes, EPA ratings) (2026-10)
- NHTSA 5-Star Safety Ratings: 2026 Tesla Model 3 4-door BEV RWD (VehicleId 22553) (2026-09)
- NHTSA 5-Star Safety Ratings: 2026 Toyota Camry Hybrid 4-door HEV FWD (VehicleId 21640) (2026-10)
- J.D. Power: 2026 Tesla Model 3 Premium RWD specifications (2026-09)
- IIHS: 2026 Tesla Model 3 ratings (applies to 2025–27 models) (2026-09)
- IIHS: 2026 Toyota Camry ratings (apply to 2025–26 models) (2026-10)
- IIHS: IIHS pushes improvements in crash avoidance with 2026 awards (Mar 24, 2026) (2026-03)
Badges: Published figures come from the maker, a regulator or a rating agency; Tested from an independent instrumented test; Simulated are computed by our physics from those inputs (how); Estimate means no published value exists. Confirm figures with the maker or your dealer before you buy.